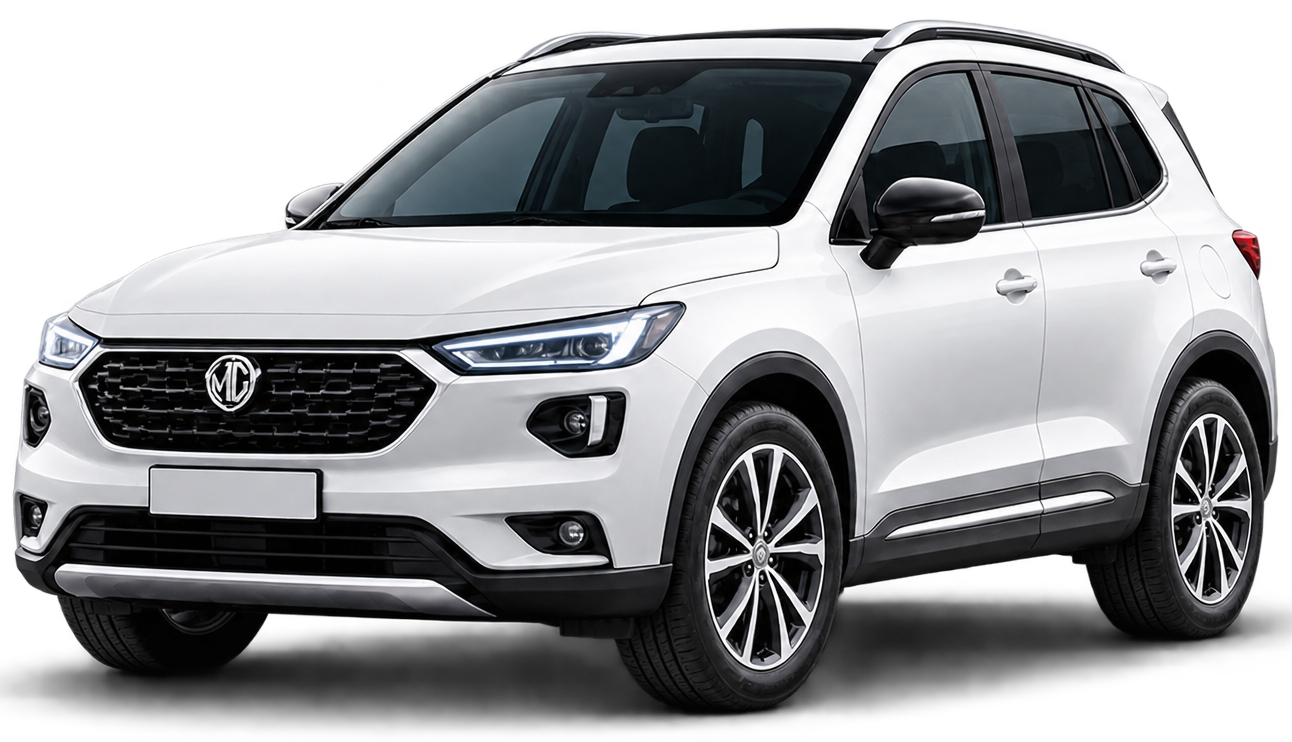
Running Cost Comparison: Petrol vs. Electric—how much do you actually save over 50,000 km?


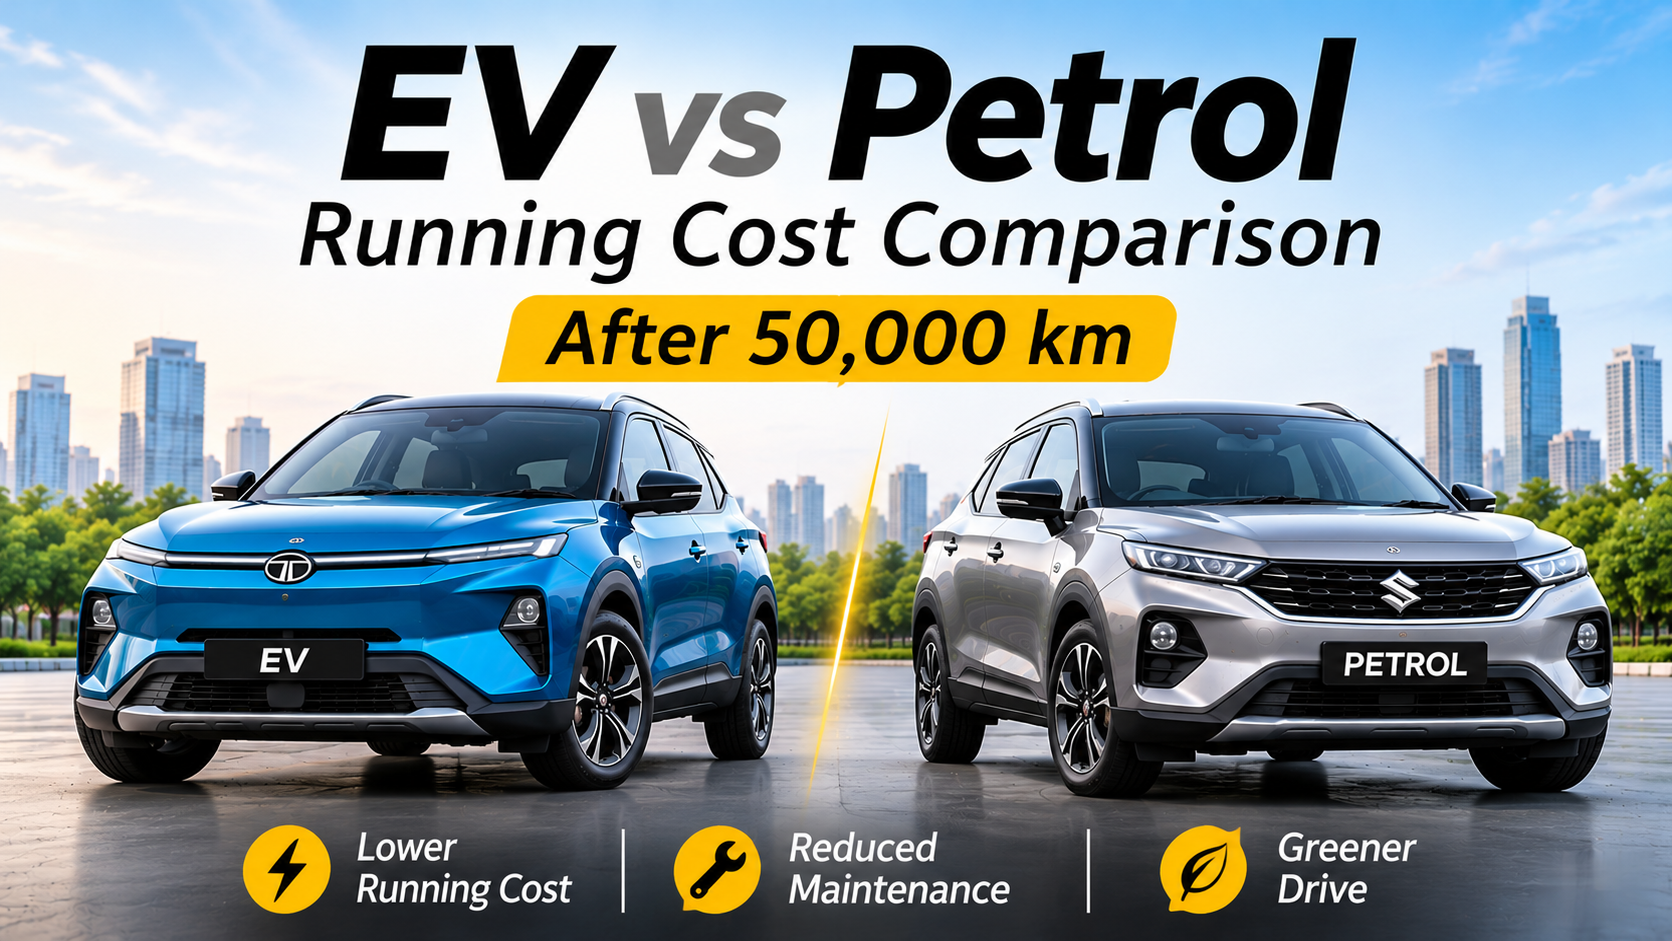
When evaluating a new vehicle purchase, the showroom sticker price commands immediate attention. In the Indian automotive landscape, battery electric vehicles (EVs) carry an initial purchase premium ranging between ₹2.5 lakh and ₹3.5 lakh compared to equivalent internal combustion engine (ICE) petrol variants. However, assessing vehicle affordability solely by the upfront on-road invoice overlooks long-term operational financial realities.
To uncover the true monetary impact of vehicle ownership, buyers must evaluate Total Cost of Ownership (TCO). The core financial question for urban commuters and fleet buyers is straightforward: at what kilometer milestone does lower operational expenditure recover the initial capital premium?
Analyzing a standard mid-term ownership benchmark of 50,000 kilometers—representing roughly three to four years of regular driving—reveals how real-world energy efficiency, scheduled servicing protocols, and charging setups alter vehicle economics. Evaluating the ev vs petrol running cost per km over 50,000 km provides clear mathematical proof of long-term financial savings.
Energy Economics: Fuel vs Electricity Cost Per Kilometer
Determining operational expenditure begins by analyzing the raw energy requirements of propelling a compact crossover down Indian roads
Per-Kilometer Energy & Running Cost Comparison
| Fuel / Energy Type | Average Efficiency Benchmark | Local Energy / Fuel Rate | Real-World Energy Cost Per KM |
| Petrol ICE | 14.0 km/L (Mixed Urban/Highway) | ₹102.12 / Litre | ₹7.29 / km |
| Electric (Home AC Charger) | 6.5 – 7.0 km/kWh | ₹7.50 / kWh (+12% AC conversion loss) | ₹1.20 / km |
| Electric (Public DC Fast Charger) | 6.0 – 6.5 km/kWh | ₹21.00 / kWh (incl. 18% GST) | ₹3.23 – ₹3.50 / km |
| Electric (85% Home / 15% Public Mix) | ~6.5 km/kWh | Weighted Average Tariffs | ₹1.50 / km |
Real-World Fuel Economy vs EV Efficiency
A modern 1.2-liter turbocharged petrol compact SUV delivers a real-world mixed efficiency of 13 to 14 km/L under typical Indian urban and highway driving conditions. With metropolitan petrol prices benchmarked around ₹102.12 per litre (metro average), the direct per-kilometer fuel expense calculates as follows:
Petrol Fuel Spend = ₹102.12 % 14 km/L = ₹7.29\per km
By comparison, a compact electric SUV equipped with a 30 kWh to 45 kWh battery pack records a real-world efficiency of 6.5 to 7.0 km per kWh (approximately 14.5 kWh per 100 km).
This performance disparity is rooted in fundamental physics. Internal combustion engines convert only 20% to 30% of chemical thermal energy into rotational kinetic energy; the remaining energy dissipates as engine heat and mechanical friction. Conversely, permanent magnet synchronous electric motors convert 85% to 90% of grid energy directly into propulsion.
Home AC Wallbox vs Public DC Fast Charging Tariffs
Calculating electric vehicle operational costs depends directly on where the vehicle is plugged in:
- Home AC Wallbox Charging: Domestic tier-2 and tier-3 electricity rates in most Indian states average roughly ₹7.50 per kWh. Accounting for a 12% AC-to-DC conversion heat loss during home charging cycles, the true wall-to-wheel cost translates to:
EV Home Running Cost = ₹7.5 * 1.12 % 7.0 km/kwh
= ₹1.20 per km
- Public DC Fast Charging Networks: Commercial 50 kW to 150 kW DC fast-charging hubs levy operator service fees alongside 18% GST, raising tariffs to ₹18.00–₹24.00 per kWh. This elevates public fast-charging running costs to ₹3.00–₹3.50 per km.
Assuming an 85% home charging and 15% public fast-charging split over 50,000 km, the weighted average EV energy spend sits at ₹1.50 per km.
50,000 km Total Operational Cost Audit
Integrating direct energy spend, scheduled routine maintenance, and consumable wear-and-tear items provides a complete financial breakdown over a 50,000 km lifecycle.
Complete 50,000 km Operational Expense Matrix
| Expense Category | Petrol Compact SUV (e.g., Nexon Turbo-Petrol) | Electric Compact SUV (e.g., Nexon EV 45 kWh) | Direct Savings / Difference |
| Average Energy / Fuel Expense per KM | ₹7.29 / km | ₹1.50 / km (85% Home / 15% Public Split) | ₹5.79 saved / km |
| 50,000 KM Cumulative Fuel / Energy Spend | ₹3,64,500 | ₹75,000 | ₹2,89,500 Saved |
| Scheduled Routine Maintenance | ~₹35,000 (Engine oil, spark plugs, filters, belt checks) | ~₹15,000 (Cabin air filter, brake fluid, coolant) | ₹20,000 Saved |
| Friction Brake Pad Replacements | ~₹8,000 (2 replacement cycles over 50,000 km) | ~₹0 (Regenerative braking reduces pad wear by 70%) | ₹8,000 Saved |
| Accelerated Tire Wear Wear-and-Tear | ~₹22,000 (Standard 50,000 km replacement cycle) | ~₹25,300 (+15% wear due to EV torque/weight) | -₹3,300 (EV Penalty) |
| Total Operational Spend over 50,000 KM | ₹4,29,500 | ₹1,15,300 | ₹3,14,200 Total Savings |
Over 50,000 km, an electric vehicle owner saves ₹3.14 lakh in pure operational expenditure.
Upfront Price Delta and EV Break-Even Kilometers
Evaluating total returns requires factoring in the initial purchase price gap between vehicle variants.
Financial Payback & Break-Even Timeline Matrix
| Annual Driving Mileage | Monthly Distance | Upfront Price Premium (EV vs Petrol) | Net Operational Savings Per KM | Break-Even Distance | Financial Payback Horizon |
| 20,000 km / year | ~1,660 km / mo | ₹3,00,000 | ₹6.28 / km | 47,770 km | 2.3 Years |
| 15,000 km / year | ~1,250 km / mo | ₹3,00,000 | ₹6.28 / km | 47,770 km | 3.1 Years |
| 12,000 km / year | ~1,000 km / mo | ₹3,00,000 | ₹6.28 / km | 47,770 km | 3.9 Years |
| 6,000 km / year | ~500 km / mo | ₹3,00,000 | ₹6.28 / km | 47,770 km | 7.9 Years (Low ROI) |
Calculating the Capital Recovery Point
An electric compact SUV typically commands an on-road price premium of approximately ₹3,00,000 over its equivalent petrol counterpart.
To calculate the exact break-even kilometer milestone where running cost savings absorb the higher purchase price:
Timeline to Payback
The duration required to cross this break-even threshold depends on annual driving mileage:
Cross-Powertrain Operational Comparison (50,000 km Horizon)
| Powertrain Type | Real-World Efficiency Benchmark | Average Fuel / Energy Rate | 50,000 km Energy Spend | Maintenance Complexity Profile |
| Petrol ICE | 14.0 km/L | ₹102.12 / L | ₹3,64,500 | High (2,000+ moving parts, periodic oil/filter changes) |
| Diesel ICE | 18.0 km/L | ₹89.62 / L | ₹2,48,944 | High (DPF upkeep, fuel injectors, periodic oil changes) |
| Factory CNG | 24.0 km/kg | ₹76.50 / kg | ₹1,59,375 | Moderate (Valve clearances, hydro-testing, filters) |
| EV (100% Home AC) | 6.5 km/kWh | ₹7.50 / unit (+loss) | ₹60,000 | Low (~20 moving parts, no engine fluids) |
| EV (100% Public DC) | 6.0 km/kWh | ₹21.00 / unit | ₹1,75,000 | Low (~20 moving parts, no engine fluids) |
- High-Mileage Driver (20,000 km/year): Reaches full capital recovery in 2.3 years.
- Average Urban Commuter (12,000 km/year): Reaches full capital recovery in 3.9 years.
- Low-Mileage Driver (<6,000 km/year): Takes over 7.5 years—making a traditional petrol car the simpler short-term financial choice.
Battery-as-a-Service (BaaS) Business Models
Innovative vehicle ownership models like Battery-as-a-Service (BaaS), introduced by manufacturers such as MG Motor India, alter initial purchase calculations. By separating battery pack ownership from the vehicle chassis and charging a dedicated battery subscription rate per kilometer (e.g., ₹3.50/km), initial showroom prices drop to parity with petrol vehicles. This converts capital expenditure into operational expenditure, delivering net savings from day one.
Servicing Dynamics and Hidden Ownership Costs
The mechanical simplicity of electric powertrains modifies long-term servicing requirements.
Servicing Savings
A traditional internal combustion engine comprises over 2,000 moving parts requiring periodic service, including engine oil, oil filters, spark plugs, fuel filters, timing belts, and clutch assemblies.
Electric powertrains reduce moving parts to fewer than 20, replacing intensive engine maintenance with simple cabin filter swaps, coolant checks, and brake fluid flushes.
Additionally, regenerative braking utilizes the traction motor as a generator to slow the car, recovering kinetic energy back into the battery. This reduces mechanical friction pad wear by up to 70%, extending brake pad service lifespans past 60,000 km.
Hidden Ownership Expenses
Electric vehicle ownership introduces specific auxiliary costs:
| Category | Petrol Vehicle | Electric Vehicle (EV) | Cost Difference / Impact |
| Discom Load Upgrade (7.2 kW Wallbox) | N/A | ₹6,000 – ₹12,000 | One-time initial EV setup fee |
| First-Year Comprehensive Insurance (OD) | ~₹30,000 – ₹32,000 | ~₹36,000 – ₹40,000 | EV premium is 10%–15% higher due to battery valuation |
| State Road Tax & Registration (Delhi/Select States) | 8% – 10% of Ex-Showroom | ₹0 (100% Exempted) | Saves ₹80,000 – ₹1,80,000 on initial EV purchase |
| Brake Pad Service Interval | 25,000 – 30,000 km | 60,000 – 70,000 km | EV regenerates kinetic energy, cutting pad wear by 70% |
- DISCOM Load Upgrades: Installing a 7.2 kW AC home charger frequently requires enhancing sanctioned domestic utility connections. DISCOM load enhancement charges range between ₹6,000 and ₹12,000.
- Insurance Premiums: Own Damage (OD) insurance coverage for EVs costs 10% to 15% more than petrol vehicles due to battery pack valuation parameters during total-loss claims.
- Accelerated Tire Wear: Instant electric motor torque coupled with a 250+ kg battery weight surplus accelerates tire tread wear by roughly 15%, slightly shortening replacement intervals.
India-Specific EV Market Realities
Local regulatory frameworks and utility structures play a vital role in EV ownership economics:
- State Electricity Slab Variations: Domestic electricity rates vary significantly across Indian states. Residential rates in Delhi/NCR (₹4.50–₹7.50/unit) produce lower home charging costs than higher tariff structures in Maharashtra or Karnataka (₹9.00–₹11.00/unit).
- Road Tax Waivers: Multiple Indian states provide 100% road tax and registration fee exemptions for electric vehicles. This saves buyers between ₹80,000 and ₹1,80,000 upfront, shortening the break-even timeline toward 35,000 km.
- Battery Degradation Data: Telematics data from modern Lithium Iron Phosphate (LFP) cell chemistry indicates minimal capacity loss averaging 1.5% to 2.0% per year. Supported by standard 8-year / 1,60,000 km manufacturer warranties, battery health remains well above 90% at the 50,000 km mark.
Conclusion: Is the EV Running Cost Advantage Worth It?
Comparing the ev vs petrol running cost per km confirms that electric vehicles offer a distinct financial advantage for high-mileage drivers.
Over a 50,000 km ownership lifecycle, an electric vehicle delivers over ₹3.14 lakh in total operational savings. For urban commuters covering more than 12,000 km annually with home charging access, lower running costs successfully recover the initial purchase price premium within 3 to 4 years.
Frequently Asked Questions
Q.1How much money do you actually save driving an EV for 50,000 km?
Q.2Is public DC fast charging as economical as home charging?
Q.3Will an EV battery need replacement at 50,000 km?
Q.4Is a petrol car better for low-mileage drivers?
Q.5How many kilometers are needed to break even on an EV's higher purchase price?
Looking to buy an EV?
Compare, explore and find the perfect electric vehicle for you.
Explore EVs